 |  |
QSAR | |
| |
QSAR | |
|
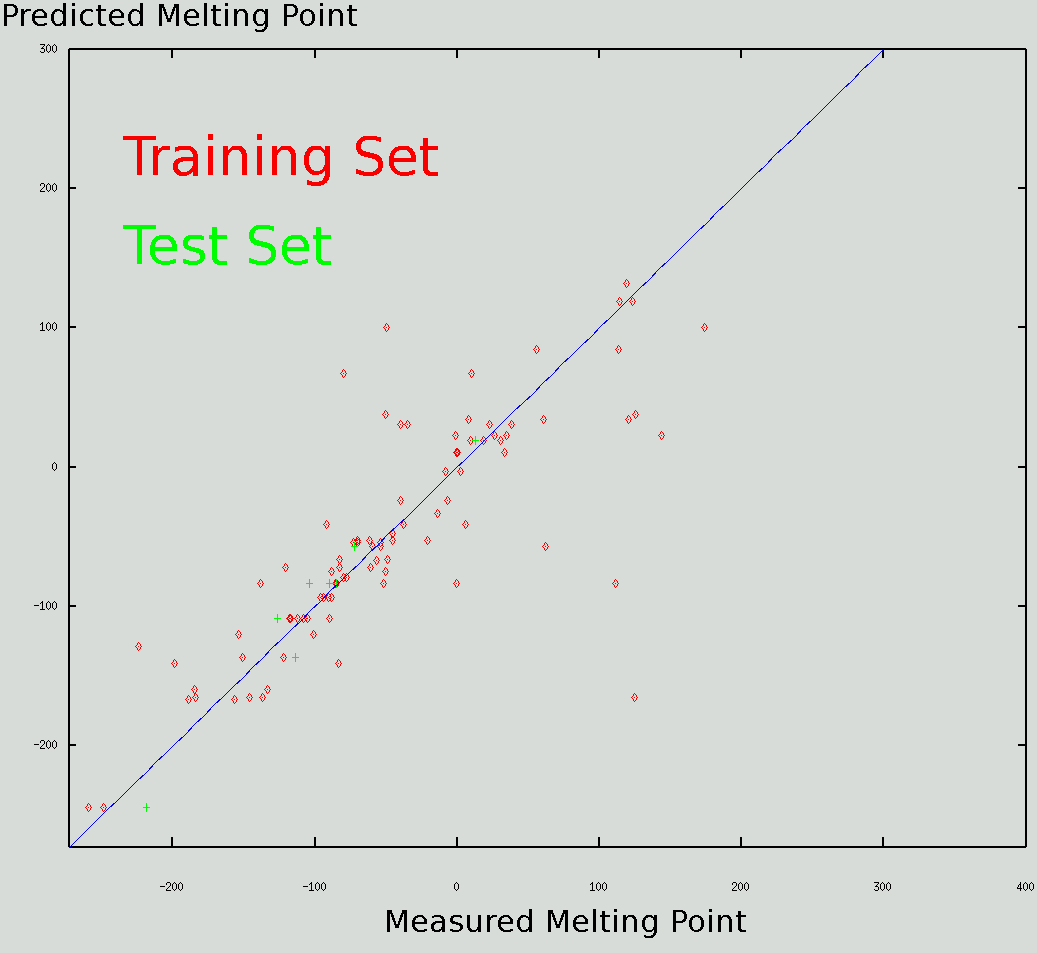
QSAR Predicting Melting Points of Molecular Inorganic Compounds Abstract A recursive propagation regression tree QSAR engine was implemented in C++. It was successfully used to predict melting points of small molecular inorganic compounds below 0 °C, however its performance for large inorganic compounds was not very good. An unexpectedly high correlation between density and melting point was found.
Introduction QSAR1 stands for quantitative structural-activity relationship. This is a method for data analysis, that allows one to make predictions about properties of substances from measurements made on similar substances. QSAR2 is widely used in pharmaceutical industry to aid in drug discovery process. In that area researchers look for a set of compounds with some particular activity. The activity can be how well the compound binds to some protein receptor, or how easily it kills a bacteria. First, a library of 50 to 100000 compounds is made. Then activities of those compounds is determined. After that both activities and descriptors for that set of compounds are used to train a QSAR program. The QSAR program is used to predict which other substances, not included in the original library, will have large activity. Such substances are added to the library, and QSAR program is used again on the expanded library. This process is repeated many times until a set of highly active compounds is obtained. A QSAR program always needs two sets of inputs: activities and descriptors. Descriptors are things used to describe molecules to the QSAR program. They can be as simple as formula weight. Some are geometric, like the radius of gyration. Others are quantum, like HOMO-LUMO gap. There are also topological descriptors, like the number of bond in a molecule. Usually QSAR packages are interfaced with external programs that calculate descriptors. All activities and descriptors must go through an engine that learns from this data. There are two types of engines. One type is a neural network. Neural networks were originally designed to simulate biological brains. They consist of artificial neurons. During the learning process neurons are adjusted so that they fire out correct activities when they are fed with descriptors. One can also build a QSAR engine using regression trees. In this model, to make a decision about what activity to assign to a substance, the program follows a binary tree. Each node contains a descriptor and the value for that descriptor that determine which node to follow next. After going through several nodes, the program arrives at a leaf, which contains information about activity. There are several ways to build regression trees. One can build them by randomly assigning descriptors and their values to nodes. This method is very cheap computationally and, surprisingly enough, provides acceptable results. The method most frequently used today is recursive partitioning. At each node the training data set is split in the best way possible by some descriptor. The best way is determined by maximizing the distance between the centers of two groups of data. This method provides much better results than random building. Another way to build regression trees has recently been introduced by researchers from 3D Pharmaceuticals3. This method is based on a simulation of an ant colony. At first a random tree as built, just as ants scatter randomly in search of food. Then the descriptor-value pairs that worked best for the training set are marked with artificial pheromone, just like ant that find food mark their trails with a pheromone trail. Then another random tree is built, with the pheromone marked descriptor-value pairs receiving more probability to be used. After ten builds regression trees created this way have quality comparable to those built using recursive partitioning algorithm. Because ANTP is a new algorithm, it is not yet widely used. This paper describes implementation of a QSAR engine using recursive partitioning algorithm in C++. It was tested with a set of data on melting points of inorganic compounds.
Materials and methods The QSAR program was written in C++ and compiled using gcc version 2.96. It was ran on a PC with a Pentium III processor and 256 MB of RAM running Red Hat Linux 7.1. The regression tree was built by recursive partitioning using the distance between the means of activities of two groups as the decision parameter. The program was used to construct a QSAR model that predicts melting points of molecular inorganic compounds. The data on these compounds was obtained from CRC Handbook of Chemistry and Physics4. The training set consisted of 93 compounds (table 1) and the test set consisted of 8 compounds (table 2). The following descriptors were used:
Results and Conclusions The program made good predictions below 0 °C, however above that temperature results start becoming less and less accurate. The melting points of the molecules in the test set were predicted reasonably well. The program did not perform too well with large molecules. For example, Si(NCO)4 (MP=26) and P4S3 (MP=174) got on the same leaf. Such blunders were caused primarily by two things. The training set contained more small molecules, and the constructed regression tree does not contain enough information to treat large ones. The other reason is that large molecules need different descriptors than the ones used here. For example the descriptors used in this study can not distinguish between isomers. All descriptors will have identical values for cyclohexane and 3-hexene. Other leafs were very logical. For example water, hydrogen, peroxide and acetonitrile were on the same leaf. The number of times each descriptor was used in the regression tree (table 3) was surprising. This number raged from 4 to 6 for different descriptors. In general chemistry undergraduate student are taught that for molecular substances the melting point is primarily determined by the dipole moment and the molecular weight. Indeed formula weight, and number of atoms coupled with atomic weight play a significant role, but the dipole moment side is severely underrepresented. Although this is not true for such molecules as carbon dioxide, most of the time the dipole moment is related to the difference in electronegativities. However only at 4 points the decision is made using that parameter. The smallest and the largest electronegativities by themselves play a bigger role (6 and 5 decisions.) The four contributions of density to the regression tree was also a surprise. There are two possible explanations for that. Heavy substances have a greater percentage of heavy atoms in them. Heavy atoms give them greater formula weights. The other reason is that the better molecules pack in the condensed phase, the greater is the density, so density can be viewed as a geometric parameter, describing steric interactions between molecules. Although the method described in this paper works well for small inorganic molecules, its scope could probably be broadened to include larger molecules by addition of geometric descriptors.
1 Hugh M. Cartwright, Applications of Artificial Intelligence in Chemistry, Oxford University Pres, 1993. 2 Jure Zupan, Johann Gastieger Neural Networks in Chemistry and Drug Design, 2nd ed. Wiley-VCH, Weinhaim, FRG, 1999. 3 Izrailev, S.; Dimitris, A. A Novel Method for Building Regression Tree Models for QSAR Based on Artificial Ant Colony Systems. J. Chem. Inf. Comput. Sci. 2001, 41, 176-180. 4 Robert C. West, Samuel M. Selby Handbook of Chemistry and Physics, College Edition, The Chemical Rubber Co., Cleveland, Ohio, 1966. Program Listing /* ALEXANDER BAYDEN FINAL PROJECT
This C++ programm was compiled with gcc version 2.96 and ran on Red Hat Linux 7.1. */
#include <iostream.h> #include <math.h> #include <fstream.h> #include <vector> //Must have an STL compatible C++ compiler
const int nparameters=8;/*Number of different parameters by which selections will be made.*/
const bool verbose=true;//Produce deatailed output
const int namelength=18;
//Sturucture to describe one molecule struct molecule{ char name[namelength]; //formula double parameter[nparameters]; //descriptors double activity; };
void skiptonextline(ifstream &ifs) { char buffer[255]; ifs.getline(buffer,255); }
/*Reads data from datafile of form Molecule activity descriptor descriptor ... Molecule activity descriptor descriptor ... ... */ vector<molecule> readdata(char filename[]) { ifstream ifs(filename); if(!ifs) { cerr<<"Error: unable to open file" << endl; };
vector<molecule> data;
while (!ifs.eof()) { molecule thisrecord;
int i;//counter
//Read molecule name
for (i=0;i<namelength-1;i++) {ifs.get(thisrecord.name[i]);} thisrecord.name[namelength-1]=0;
//Prevents the last line from being processed twice if(ifs.eof()){break;}
ifs>>thisrecord.activity;
// read in the descriptor values for (i=0;i<nparameters;i++) { ifs>>thisrecord.parameter[i];
} skiptonextline(ifs); //skip the rest of the line
//put datum into the data vector data.insert(data.begin(),thisrecord); } ifs.close(); return data; }
//Outputs data to the screen void displaydata(vector<molecule> data) { if(data.size()==0) {cout<<"Empty"<<endl;} int i; int prop;//conuter for (i=0;i<data.size();i++) { cout<<data[i].name<<" "<<data[i].activity; for (prop=0;prop<nparameters;prop++) { cout<<" "<<data[i].parameter[prop]; } cout<<endl; }
return; }
/*This calss has been written to describe a recursion tree. Such trees consist of nodes, so this is implemented as a node that points to other nodes. The tree is a binary tree.*/
class node{ public: //All training data that passes through this node vector<molecule> data; //Data that goes left vector<molecule> leftdata; //Data that goes right vector<molecule> rightdata;
double value; //condition and value that regulate int condition; //where data go
int ndata; //number of data points referenceds to by this node
double expectationvalue; /*if this is a leaf, it is supposed to have this value*/ double CI;// with this confidence interval.
//The bigger these numbers the better the parameters double parameterquality[nparameters];
//Pointers to left and right nodes node *left; node *right;
//Constructor. Build the tree node(vector<molecule> inputdata);
~node();
//Sorts data by parameter n void sortdatabyparameter(int n);
//finds the best way to brreak up the data void findbestparameterandmidpoint(int & midpoint, int &n);
//Finds the best way to break up data for parameter n int node::bestmidpoint( int n);
//Finds the quality of breakup using //distance between least squares groups double findquality(int midpoint, int n);
//splits the data void split();
//finds the value the leaf predicts and the confidence interval //(currently just standart deviation.) void findexpectationvalueandCI();
//Makes the prediction of activity void predict(molecule& predictedmolecule, double& predictedCI, double& predictedactivity); };
void makedataplot(vector<molecule> data, node& tree) { double predictedactivity, predictedCI;
int i; for (i=0;i<data.size();i++) { tree.predict(data[i], predictedCI, predictedactivity); cout<<data[i].activity<<" "<<predictedactivity;
cout<<endl; }
return; }
int main() { vector<molecule> trainingset = readdata("training.set"); node tree(trainingset); vector<molecule> validationset = readdata("test.set"); makedataplot(validationset, tree); return 0; }
node::node(vector<molecule> inputdata) { data=inputdata; ndata=inputdata.size();
left=NULL; right=NULL;
split(); }
node::~node() { if (left!=NULL){delete left;} if (right!=NULL){delete right;} }
void node::sortdatabyparameter(int n) { int i1,i2; //counters molecule temp; for(i1=0; i1<(data.size()-1);i1++) { for (i2=i1+1; i2<data.size(); i2++) { if ((data[i1].parameter[n])>(data[i2].parameter[n])) { temp=data[i2]; data[i2]=data[i1]; data[i1]=temp; } } } return; }
void node::findbestparameterandmidpoint(int & midpoint, int &n) { int currentn; double bestquality=1e30; double currentquality; for (currentn=0;currentn<nparameters;currentn++) { midpoint=bestmidpoint(currentn); currentquality=findquality( midpoint, currentn); if (currentquality<bestquality) { bestquality=currentquality; n=currentn; }
} midpoint=bestmidpoint( n); return; }
int node::bestmidpoint( int n) { int midpoint; sortdatabyparameter(n); int m;// midpoint counter double bestquality=1e30; double currentquality; for (m=2; m<data.size()-1;m++) { currentquality=findquality( m, n); if (currentquality<bestquality) { bestquality=currentquality; midpoint=m; } } return midpoint; }
//Given the descriptor n and midpoint m finds // sum((Ylefti-Yleftmean)) + sum((Yrighti-Yrightmean)) double node::findquality(int midpoint, int n) { int i; double sum=0.0; double meanright=0.0; double meanleft =0.0; for (i=0; i<midpoint;i++) { sum+=data[i].activity; } meanleft=sum/midpoint; sum=0.0; for (i=midpoint;i<data.size();i++) { sum+=data[i].activity; } meanright=sum/(data.size()-midpoint); sum=0.0;
for (i=0; i<midpoint;i++) { sum+=(data[i].activity-meanleft)*(data[i].activity-meanleft); }
for (i=midpoint;i<data.size();i++) { sum+=(data[i].activity-meanright)*(data[i].activity-meanright); }
return sum; }
void node::split() { if (ndata<=3) { //A leaf has been reached findexpectationvalueandCI(); left=NULL; right=NULL; if (verbose) { cout<<"Leaf of size "<<ndata<<" reached."<<endl; displaydata(data); cout<<"Leaf predicts "<<expectationvalue<<" +/-"<<CI<<endl; } } else { int midpoint;
findbestparameterandmidpoint(midpoint, condition); sortdatabyparameter(condition); value = (data[midpoint].parameter[condition]+data[midpoint-1].parameter[condition])/2;
int i;//counter for(i=0; i<ndata;i++) {
if ( i < midpoint) { leftdata.insert(leftdata.begin(),data[i]); } else { rightdata.insert(rightdata.begin(),data[i]); }
}
if (verbose) { cout<<"Splitting"<<endl; displaydata(data); cout<<"into"<<endl; displaydata(leftdata); cout<<"and"<<endl; displaydata(rightdata); cout<<"by "<<condition<<" < "<<value<<"."<<endl; }
left=new node(leftdata); right=new node(rightdata); } }
void node::findexpectationvalueandCI() { int i; double sum=0.0;
for (i=0;i<ndata;i++) { sum+=data[i].activity; }
expectationvalue=sum/ndata;
sum=0.0; for (i=0;i<ndata;i++) { sum+=(expectationvalue-data[i].activity)* (expectationvalue-data[i].activity); } CI=sqrt(sum)/(ndata-1); }
void node::predict(molecule& predictedmolecule, double& predictedCI, double& predictedactivity) { if (right==NULL) { predictedCI=CI; predictedactivity=expectationvalue; } else { if (predictedmolecule.parameter[condition] < value) { left->predict( predictedmolecule, predictedCI,predictedactivity); } else { right->predict( predictedmolecule, predictedCI,predictedactivity); } } return; } |